Debugging a Unikernel
Debugging a Unikernel#
For those in the know, this particular topic may be the one that is most controversial, with the regular proclamation that "debugging unikernels" is hard. This page aims to demonstrate many of the tools and facilities which make this process much easier with Unikrkaft.
Contrary to popular belief, debugging a unikernel is in fact simpler than debugging a standard operating system. Since the application and OS are linked into a single binary, debuggers can be used on the running unikernel to debug both application and OS code at the same time. A couple of hints that should help starting:
- In the configuration menu (presented with
make menuconfig), underBuild Optionsmake sure thatDrop unused functions and datais unselected. This prevents Unikraft from removing unused symbols from the final image and, if enabled, might hide missing dependencies during development. - Use
make V=1to see verbose output for all of the commands being executed during the build. If the compilation for a particular file is breaking and you would like to understand why (e.g., perhaps the include paths are wrong), you can debug things by adding the-Eflag to the command, removing the-o [objname], and redirecting the output to a file which you can then inspect. - Check out the targets under
Miscellaneouswhen typingmake help, these may come in handy. For instance,make print-varsenables inspecting the value of a particular variable inMakefile.uk. - Use the individual
make clean-[libname]targets to ensure that you're cleaning only the part of Unikraft you're working on and not all the libraries that it may depend on. This will speed up the build and thus the development process.
Using GDB#
The build system always creates two image files for each selected platform:
- one that includes debugging information and symbols (
.dbgfile extension) - one that does not
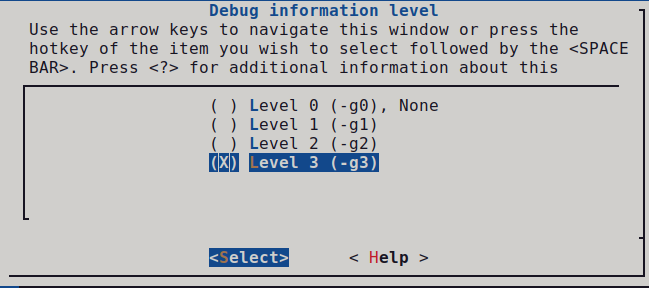
Before using GDB, go to the configuration menu under Build Options and select a Debug information level that is bigger than 0.
We recommend 3, the highest level.
Once set, save the configuration and build your images.
KVM#
For KVM, you need to start the guest with the kernel image that does not include debugging information.
We recommend creating the guest in a paused state (the -S option):
$ qemu-system-x86_64 -s -S -cpu host -enable-kvm -m 128 -nodefaults -no-acpi -display none -serial stdio -device isa-debug-exit -kernel build/app-helloworld_kvm-x86_64 -append verbose
Note that the -s parameter is shorthand for -gdb tcp::1234.
Now connect GDB by using the debug image with:
$ gdb --eval-command="target remote :1234" build/app-helloworld_kvm-x86_64.dbg
Unless you're debugging early boot code (until _libkvmplat_start32), you’ll need to set a hardware breakpoint.
Hardware breakpoints have the same effect as the common software breakpoints you are used to, but they are different in the implementation.
As the name suggests, hardware breakpoints are based on direct hardware support.
This may limit the number of breakpoints you can set, but makes them especially useful when debugging kernel code.
hbreak [location]continue
We’ll now need to set the right CPU architecture:
disconnectset arch i386:x86-64:intel
And reconnect:
tar remote localhost:1234
You can now run continue and debug as you would normally.
Xen#
Running Unikraft in Xen#
For Xen you first need to create a VM configuration (save it under
helloworld.cfg):name = 'helloworld'vcpus = '1'memory = '4'kernel = 'build/app-helloworld_xen-x86_64.dbg'Start the virtual machine with:
$ xl create -c helloworld.cfg
For Xen the process is slightly more complicated and depends on Xen's gdbsx tool.
First you'll need to make sure you have the tool on your system.
Here are sample instructions to do that:
[get Xen sources]$ ./configure$ cd tools/debugger/gdbsx/ && make
The gdbsx tool will then be under tools/debugger.
For the actual debugging, you first need to create the guest (we recommend paused state: xl create -p), note its domain ID (xl list) and execute the debugger backend:
$ gdbsx -a [DOMAIN ID] 64 [PORT]
You can then connect GDB within a separate console and you're ready to debug:
$ gdb --eval-command="target remote :[PORT]" build/helloworld_xen-x86_64.dbg
You should be also able to use the debugging file (build/app-helloworld_xen-x86_64.dbg) for GDB instead passing the kernel image.
Connect with the community
Feel free to ask questions, report issues, and meet new people.