DocsReleasesCommunityGuidesBlog

Debugging

Unikernels aim to be a more efficient method of virtualization, and this can sometimes cause problems. This guide aims to familiarize you with solving problems encountered during the development using GDB. This is going to be a more practical guide, with a focus on exercises.

Reminders#

At this stage, you should be familiar with the steps of configuring, building and running any application within Unikraft and know the main parts of the architecture. Below you can see a list of useful commands.

CommandDescription
make cleanClean the application
make propercleanClean the application, fully remove the build/ folder
make distcleanClean the application, also remove .config
make menuconfigConfigure application through the main menu
makeBuild configured application (in .config)

Today we'll make use of gdb. We recommend the following cheat sheet for the most common commands. A quick crash course on GDB may be found here.

Let's take a look over some of GDB's commands. First, we need to start running the binary, for this we have the run command.

(gdb) run
Program received signal SIGSEGV, Segmentation fault.
0x00000000006005ad in print_arr (arr=0x0, pos=4) at my_program.c:16
16 int elem = arr[pos];

We can quickly see that the segmentation fault was caused by line 16 in our program Let us inspect the backtrace using backtrace.

(gdb) backtrace
#0 0x00000000004005ad in print_arr (arr=0x0, pos=4) at my_program.c:16
#1 0x000000000040064b in main (argc=2, argv=0x7fffffffe2f8) at my_program.c:30

To inspect the frames we can run:

(gdb) frame 0
#0 print_arr (arr=0x0, pos=4) at program.c:16
16 int elem = arr[pos];

In many cases we would like to run the code up to the point where the crash happens. To do this, we will use breakpoints.

(gdb) break print_arr
(gdb) break print_arr if arr == 0
(gdb) break program.c:16

Debugging#

Contrary to popular belief, debugging an unikernel is simpler than debugging a standard operating system. Since the application and OS are linked into a single binary, debuggers can be used on the running unikernel to debug both application and OS code at the same time. A couple of things you should know before you get started:

  1. In the configuration menu (presented with make menuconfig), under Build Options make sure that Drop unused functions and data is unselected. This prevents Unikraft from removing unused symbols from the final image and, if enabled, might hide missing dependencies during development.
  2. Use make V=1 to see verbose output for all the commands being executed during the build. If the compilation for a particular file is breaking and you would like to understand why (e.g., perhaps the included paths are wrong), you can debug things by adding the -E flag to the command, removing the -o [objname], and redirecting the output to a file which you can then inspect.
  3. Check out the targets under Miscellaneous when typing make help, these may come in handy. For instance, make print-vars enables inspecting at the value of a particular variable in Makefile.uk.
  4. Use the individual make clean-[libname] targets to ensure that you're cleaning only the part of Unikraft you're working on and not all the libraries that it may depend on. This will speed up the build and thus the development process.
  5. Use the Linux user space platform target (linuxu) for quicker and easier development and debugging.

Using GDB#

TThe build system always creates two image files for each selected platform:

  • one that includes debugging information and symbols (.dbg file extension)
  • one that does not

Before using GDB, go to the configuration menu under Build Options and select a Debug information level that is bigger than 0. We recommend 3, the highest level.

Selecting the Debug Level

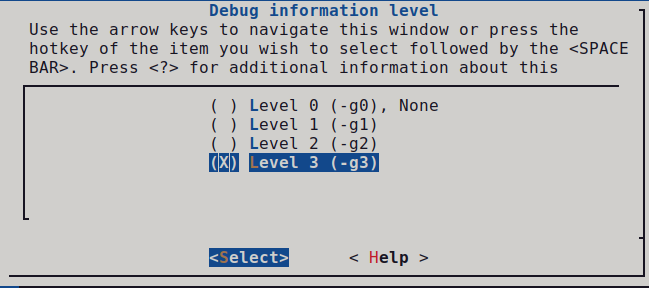
Once set, save the configuration and build your images.

Linuxu#

For the Linux user space target (linuxu) simply point GDB to the resulting debug image, for example:

gdb build/app-helloworld_linuxu-x86_64.dbg

KVM#

For KVM, you can start the guest with the kernel image that includes debugging information, or the one that does not. We recommend creating the guest in a paused state (the -S option):

qemu-system-x86_64 -s -S -cpu host -enable-kvm -m 128 -nodefaults -no-acpi -display none -nographic -device isa-debug-exit -kernel build/app-helloworld_kvm-x86_64 -append verbose

Note that the -s parameter is shorthand for -gdb tcp::1234.

Now connect GDB by using the debug image with:

gdb --eval-command="target remote :1234" build/app-helloworld_kvm-x86_64.dbg

Unless you're debugging early boot code (until _libkvmplat_start32), you’ll need to set a hardware break point. Hardware breakpoints have the same effect as the common software breakpoints you are used to, but they are different in the implementation. As the name suggests, hardware breakpoints are based on direct hardware support. This may limit the number of breakpoints you can set, but makes them especially useful when debugging kernel code.

hbreak [location]
continue

We'll now need to set the right CPU architecture:

disconnect
set arch i386:x86-64:intel

And reconnect:

tar remote localhost:1234

You can now run continue and debug as you would do normally.

Xen#

For Xen, you first need to create a VM configuration (save it under helloworld.cfg):

name = 'helloworld'
vcpus = '1'
memory = '4'
kernel = 'build/app-helloworld_xen-x86_64.dbg'

Start the virtual machine with:

xl create -c helloworld.cfg

For Xen the process is slightly more complicated and depends on Xen's gdbsx tool. First you'll need to make sure you have the tool on your system. Here are sample instructions to do that:

# get Xen sources
./configure
cd tools/debugger/gdbsx/ && make

The gdbsx tool will then be under tools/debugger. For the actual debugging, you first need to create the guest (we recommend paused state: xl create -p), note its domain ID (xl list) and execute the debugger backend:

gdbsx -a [DOMAIN ID] 64 [PORT]

You can then connect GDB within a separate console and you're ready to debug:

gdb --eval-command="target remote :[PORT]" build/helloworld_xen-x86_64.dbg

You should also be able to use the debugging file (build/app-helloworld_xen-x86_64.dbg) for GDB instead passing the kernel image.

Tracepoints#

Because Unikraft needs a tracing and performance measurement system, one method to do this is using Unikraft's tracepoint system. A tracepoint provides a hook to call a function that you can provide at runtime. You can put tracepoints at important locations in the code. They are lightweight hooks that can pass an arbitrary number of parameters, which prototypes are described in a tracepoint declaration placed in a header file.

Dependencies#

We provide some tools to read and export trace data that were collected with Unikraft's tracepoint system. The tools depend on Python3, as well as the click and tabulate modules. You can install them by running (Debian/Ubuntu):

sudo apt-get install python3 python3-click python3-tabulate

Enabling Tracing#

Tracepoints are provided by lib/ukdebug. To enable Unikraft to collect trace data, enable the option CONFIG_LIBUKDEBUG_TRACEPOINTS in your configuration (via make menuconfig under Library Configuration -> ukdebug -> Enable tracepoints).

Enabling Tracepoints

The configuration option CONFIG_LIBUKDEBUG_ALL_TRACEPOINTS activates all existing tracepoints. Because tracepoints may noticeably affect performance, you can alternatively enable tracepoints only for compilation units that you are interested in.

This can be done with the Makefile.uk of each library.

# Enable tracepoints for a whole library
LIBNAME_CFLAGS-y += -DUK_DEBUG_TRACE
LIBNAME_CXXFLAGS-y += -DUK_DEBUG_TRACE
# Alternatively, enable tracepoints of source files you are interested in
LIBNAME_FILENAME1_FLAGS-y += -DUK_DEBUG_TRACE
LIBNAME_FILENAME2_FLAGS-y += -DUK_DEBUG_TRACE

This can also be done by defining UK_DEBUG_TRACE in the head of your source files. Please make sure that UK_DEBUG_TRACE is defined before <uk/trace.h> is included:

#ifndef UK_DEBUG_TRACE
#define UK_DEBUG_TRACE
#endif
#include <uk/trace.h>

As soon as tracing is enabled, Unikraft will store samples of each enabled tracepoint into an internal trace buffer. Currently this is not a circular buffer. This means that as soon as it is full, Unikraft will stop collecting further samples.

Creating Tracepoints#

Instrumenting your code with tracepoints is done by two steps. First, you define and register a tracepoint handler with the UK_TRACEPOINT() macro. Second, you place calls to the generated handler at those places in your code where your want to trace an event:

#include <uk/trace.h>
UK_TRACEPOINT(trace_vfs_open, "\"%s\" 0x%x 0%0o", const char*, int, mode_t);
int open(const char *pathname, int flags, ...)
{
trace_vfs_open(pathname, flags, mode);
/* lots of cool stuff */
return 0;
}

UK_TRACEPOINT(trace_name, fmt, type1, type2, ... typeN) generates the handler trace_name() (static function). It will accept up to 7 parameters of type type1, type2, etc. The given format string fmt is a printf-style format which will be used to create meaningful messages based on the collected trace parameters. This format string is only kept in the debug image and is used by the tools to read and parse the trace data. Unikraft's trace buffer stores for each sample a timestamp, the name of the tracepoint, and the given parameters.

Reading Trace Data#

Unikraft is storing trace data to an internal buffer that resides in the guest's main memory. You can use GDB to read and export it. For this purpose, you will need to load the uk-gdb.py helper script into your GDB session. It adds additional commands that allow you to list and store the trace data. We recommend to automatically load the script to GDB. For this purpose, run the following command in GDB:

source /path/to/your/build/uk-gdb.py

In order to collect the data, open GDB with the debug image and connect to your Unikraft instance as described in Section Using GDB:

gdb build/app-helloworld_linuxu-x86_64.dbg

The .dbg image is required because it contains offline data needed for parsing the trace buffer.

As soon as you let your guest run, samples should be stored in Unikraft's trace buffer. You can print them by issuing the GDB command uk trace:

(gdb) uk trace

Alternatively, you can save all trace data to disk with uk trace save <filename>:

(gdb) uk trace save traces.dat

It may make sense to connect with GDB after the guest execution has been finished (and the trace buffer got filled). For this purpose, make sure that your hypervisor is not destroying the instance after guest shut down (on QEMU add --no-shutdown and --no-reboot parameters).

If you are seeing the error message Error getting the trace buffer. Is tracing enabled?, you probably did not enable tracing or Unikraft's trace buffer is empty. This can happen when no tracepoint was ever called.

Any saved trace file can be later processed with the trace.py script, available in the support scripts from the unikraft core repository. In our example:

/path/to/unikraft/core/repo/support/scripts/uk_trace/trace.py list traces.dat

Work Items#

Support Files#

Session support files are available in this repository. If you already cloned the repository, update it and enter the session directory:

git pull --rebase origin master
cd debugging

If you haven't cloned the repository yet, clone it and enter the session directory:

git clone https://github.com/unikraft-upb/guides-exercises
cd debugging

01. Tutorial: Use GDB in Unikraft#

For this tutorial, we will just start the app-helloworld application and inspect it with the help of GDB. First make sure you have the following conventional working directory also shown in the helloworld repository.

.
app-helloworld/
|-- Makefile
....
`-- workdir
`-- unikraft
`-- libs
`-- lib-...

For instructions on building app-hellworld using the manual method, see the application README.

Linuxu#

For the image for the linuxu platform we can use GDB directly with the binary already created because the resulting image is an actual Linux binary.

gdb build/app-helloworld_linuxu-x86_64.dbg

KVM#

To avoid using a command with a lot of parameters that you noticed above in the KVM section, we can use the qemu-guest script.

wget https://github.com/unikraft/unikraft/blob/staging/support/scripts/qemu-guest
chmod a+x qemu-guest
./qemu-guest -P -g 1234 -k build/app-helloworld_kvm-x86_64

Open another terminal to connect to GDB by using the debug image with:

gdb --eval-command="target remote :1234" build/app-helloworld_kvm-x86_64.dbg

First you can set the right CPU architecture and then reconnect:

disconnect
set arch i386:x86-64:intel
tar remote localhost:1234

Then you can put a hardware break point at main function and run continue:

hbreak main
continue

All steps described above can be done using the script kvm_gdb_debug located in the 01-gdb folder. All you need to do is to provide the path to kernel image.

kvm_gdb_debug build/app-helloworld_kvm-x86_64.dbg

02. Mystery: Find the secret using GDB#

Before starting the task, let's get familiar with some GDB commands.

ni - go to the next instruction, but skip function calls

si - go to the next instruction, but enters function calls

c - continue execution to the next breakpoint

p expr - display the value of an expression

x addr - get the value at the indicated address (similar to p *addr)

whatis arg - print the data type of arg

GDB provides convenience variables that you can use within GDB to hold on to a value and refer to it later. For example:

(gdb) set $foo = *object_ptr

Note that you can also cast variables in GDB similar to C:

(gdb) set $var = (int *) ptr

If you want to dereference a pointer and actually see the value, you can use the following command:

(gdb) p *addr

You can find more GDB commands here Also, if you are unfamiliar with X86_64 calling convention you can read more about it here.

Now, let's get back to the task. Navigate to 02-mystery directory. Use ./debug.sh to start the application in paused state and ./connect.sh to connect to it via GDB. Do you think you can find out the secret?

Support Instructions#

Follow these steps:

  1. Start the ./debug.sh script in a terminal and the ./connect.sh script in another terminal.

  2. In the second terminal (running ./connect.sh) run

    (gdb) hbreak main

    to break at the main() function. The use

    (gdb) c

    (for continue) to get the to main() function.

  3. Use

    (gdb) set disassembly-flavor intel
    (gdb) disass

    to disassemble the main() function.

  4. Look through the assembly code and see what it does. Follow the test eax, eax instructions and see what needs to happen to pass those tests and get to the last point where the secret is printed (i.e. be able to advance to address 0x000000000018a4ae).

  5. Investigate memory addresses (using the x instruction - such as x/s $rbp-0x120), do instruction stepping (stepi or nexti), use breakpoints (break *<address>) and find out the secret.

03. Bug or feature?#

There are two kernel images located in the 03-bug-or-feature folder. One of them is build for Linuxu, the other for KVM.

First, try to inspect what is wrong with the Linuxu image. You will notice that if you run the program you will get a segmentation fault. Why does this happen?

After you figure out what is happening with the Linuxu image, have a look at the KVM one. It was built from the code source, but when you will try to run it, you will not get a segmentation fault. Is this a bug or a feature?

Support Instructions#

Use the connect.sh and debug.sh scripts located in the task directory for debugging a Unikraft instance.

Follow these steps:

  1. Check the disassembly code of main() both in the Linuxu and the KVM image. Use GDB and then use the commands:

    (gdb) hbreak main

    to break at the main() function. The use

    (gdb) c

    (for continue) to get the to main() function.

    (gdb) set disassembly-flavor intel
    (gdb) disass
  2. Use nexti and stepi instructions to step through the code. Get a general idea of what the program does.

  3. Check the values of the rax, rdx and rbp registers. Use

    (gdb) info registers

    for that.

  4. Inspect the value of registers right after the segmentation fault message.

  5. Deduce what the issue is.

04. Nginx with or without main? That's the question#

Let's try a new application based on networking, Nginx.

First clone the repository for app-nginx and create the proper setup for it following the README.md file. For more information about the port of Nginx, check the lib-nginx repository.

  • Besides the libraries listed in the lib-nginx repository, you will also need to select the posix-event internal library in the configuration menu (Library Configuration -> posix-event).

Do you observe something strange? Where is the main.c?

Deselect this option Library Configuration -> libnginx -> Provide a main function and try to make your own main.c that will run Nginx.

Basically, this exercise has two tasks:

  • Nginx + Makefile
  • Nginx without provide main function

Further Reading#

Edit this page on GitHub

Connect with the community

Feel free to ask questions, report issues, and meet new people.

Join us on Discord!
®

Getting Started

What is a unikernel?Install CLI companion toolUnikraft InternalsRoadmap

© 2024  The Unikraft Authors. All rights reserved. Documentation distributed under CC BY-NC 4.0.